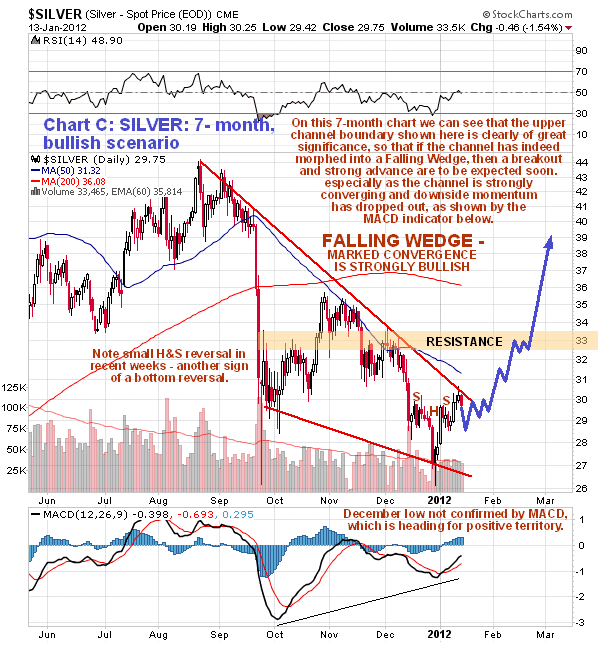
 In early January, Clive Maund said a head and shoulders top in silver was as obvious as the nose on your face. The Doc disagreed with Maund's TA & conclusion, demonstrating that silver's chart pattern in fact resembled a classic flag or falling wedge formation- a massively bullish chart formation. In the past week, silver has broken out of this pattern to the upside, as predicted here.
Well, it took Clive awhile to see it, but he finally acknowledged silver's chart formation was in fact a massive flag or falling wedge formation:

Notice that silver has in fact broken out of its massive flag formation over the past week, and is accelerating to the upside, as predicted by Maund's more proper analysis on Jan 16th.

While the 6-month chart indicates silver has already broken out of its flag formation, the 1 year and 5 year charts indicate a move to approximately $40 here would be needed for a clear breakout. With the commercials massively increasing their net shorts by 23 million ounces in the past week, the cartel may be gearing up for a substantial raid to prevent (delay) a true breakout of silver's flag pattern- but such a raid would merely continue the pattern and make the ultimate breakout even more powerful.


While we acknowledge that the cartel can make chart patterns of less consequence of those in a freely traded market, we would like to remind readers that the price target on the above flag formation silver is approximately $70 an ounce.