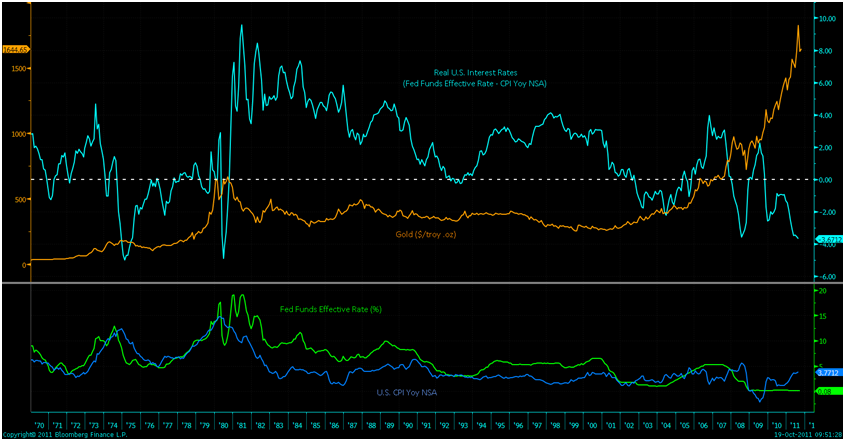
 Contrary to consensus opinion on Wall Street and many in the financial media, gold is correlated with rising interest rates in the medium and long term. The mantra that ‘gold will fall when interest rates rise’ is incorrect. It is only towards the end of an interest rate tightening cycle – when interest rates are above inflation and therefore positive - that gold is subject to weakness.
Gold rose over 24 times in the 9 year period from 1971 to January 1980 (from $35 to $850) and it is quite possible given the scale of the financial and economic challenges today that a similar performance may be seen.
At $1,650/oz gold has risen a mere 6.6 times in 12 years which puts gold’s relatively gradual appreciation in the last 12 years into perspective.
From Goldcore:
Gold is trading at USD 1,656.20, EUR 1,195.70, GBP 1,047.60, JPY 127,194, AUD 1,602.4, CHF 1,485.50 and CNY 10,564.
Gold’s London AM fix this morning was USD 1,651.00, GBP 1,045.14 and EUR 1,192.74 per ounce.
Yesterday’s AM fix was USD 1,658.00, GBP 1,054.64 and EUR 1,211.19 per ounce.

Cross Currency Table
Gold prices have fallen marginally in all major currencies today on more unsubstantiated rumours.
Markets have ignored Spain's sovereign credit rating downgrade and a plethora of rumours continue to confuse investors ahead of this weekend's European Union crisis debt summit.
Risk appetite remains high as seen in gold’s weakness and equities strength.
With France's AAA credit rating looking shakier by the day and Spain being downgraded by two notches, gold should be supported by safe haven demand.
Every day that goes by without resolving the issue of too much debt in the global financial system is a day closer to financial contagion.
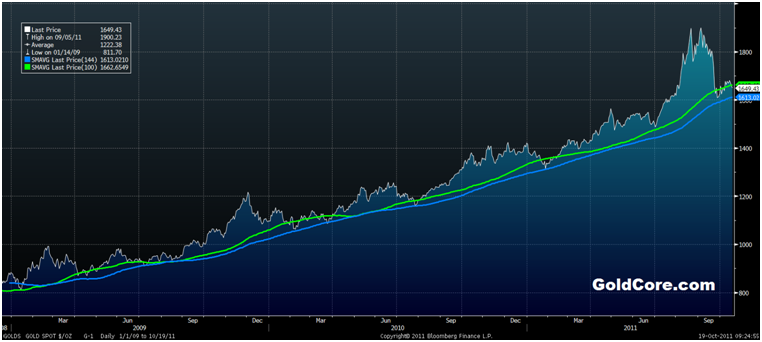
Gold looks very well supported between the 100 and 144 day moving average (simple) with the 144 day moving average providing strong support for nearly three years - since January 2009.
Bullion dealers in Hong Kong say physical demand is robust at these levels with one dealer reporting “a wave of physical buying” once prices went below $1,630/oz.
Newsletter writer, Dennis Gartman again made negative sounds about gold’s prospects.
This is bullish in the short term as many of his short term calls in recent months have been inaccurate. Indeed, some traders use him as a good short term contrarian indicator.
As ever best to ignore the noise of traders, hedge funds, commodity brokers and more speculative elements and focus on the importance of gold as a portfolio diversifier and a safe haven.
Perhaps the most important driver of higher gold prices are negative real interest rates. Savers and bond holders in the US and internationally are seeing their savings depreciate as inflation is now well above historically low interest rates in most western countries and in many emerging economies.

Real Interest Rates and Gold – 1970-2011
The Chart of the Day (‘Real Interest Rates and Gold – 1970-2011’) shows that gold prices rise during periods of negative real interest rates in the U.S. as was clearly seen in the 1970s and again since the early 2000s.

Until interest rates rise to compensate savers for the risk of saving in an untrusted banking and financial sector, gold’s bull market seems very assured. There is also the issue of savers concerns about the value of fiat currencies such as the euro going forward.
As was seen in the late 1970s, interest rates will almost certainly have to rise above real levels of inflation prior to any fall in gold prices.
What is also interesting about the chart of the day is the strong correlation between inflation, interest rates and gold.
Contrary to consensus opinion on Wall Street and many in the financial media, gold is correlated with rising interest rates in the medium and long term. The mantra that ‘gold will fall when interest rates rise’ is incorrect.
It is only towards the end of an interest rate tightening cycle – when interest rates are above inflation and therefore positive - that gold is subject to weakness.
Gold rose over 24 times in the 9 year period from 1971 to January 1980 (from $35 to $850) and it is quite possible given the scale of the financial and economic challenges today that a similar performance may be seen.
At $1,650/oz gold has risen a mere 6.6 times in 12 years which puts gold’s relatively gradual appreciation in the last 12 years into perspective.
The CPI inflation adjusted high of $2,500/oz remains a possible price target and may be seen in 2012. Some analysts like Robin Griffiths of Cazenove Capital believe that the RPI inflation adjusted high of $8,000/oz may be a better long term record high price target.
Regardless of future prices of gold, the important fact is that as long as there is no opportunity cost for holding gold (due to gold’s lack of yield) then gold will remain in demand internationally which is likely to lead to higher prices.
Negative real interest rates in the UK, the EU and the US is very bullish and a factor that is being ignored by the less informed and those simplistically calling gold a bubble.
For the latest news and commentary on financial markets and gold please follow us on Twitter.
SILVER
Silver is trading at $31.98/oz, €23.10/oz and £20.24/oz
PLATINUM GROUP METALS
Platinum is trading at $1,529.00/oz, palladium at $616/oz and rhodium at $1,525/oz.
NEWS
(Bloomberg)
Gold Falls for Third Day as Rescue-Fund Report Limits Demand
(Reuters)
Gold steady, awaits cues on Europe plan
(Bloomberg)
Gold Advances as Spain Rating Cut by Moody's Spurs Demand for Haven Assets
(Bloomberg)
Commodity-Speculation Limits Approved in 3-2 Vote by U.S. Regulator CFTC
(Reuters)
U.S. cracks down on commodity traders; will it stick?
COMMENTARY
(ZeroHedge)
Nassim Taleb On OccupyWallStreet And His Updated Views On The Global Banking System
(Kitco News)
The Great Silver Debate - Murphy V Christian
(Market Oracle)
UK Inflation Accelerates to CPI 5.2%, Bankrupt Britain's Stealth Debt Default Continues
(King World News)
John Embry - Gold & Silver Close to Taking Off
(Resource Investor)
Is There Any Gold in Fort Knox?
(Money Week)
If you don’t own gold, now’s a good time to buy